Politics
Legalizing Drugs Would Boost US Budgets By $100 Billion, Harvard Researcher Concludes

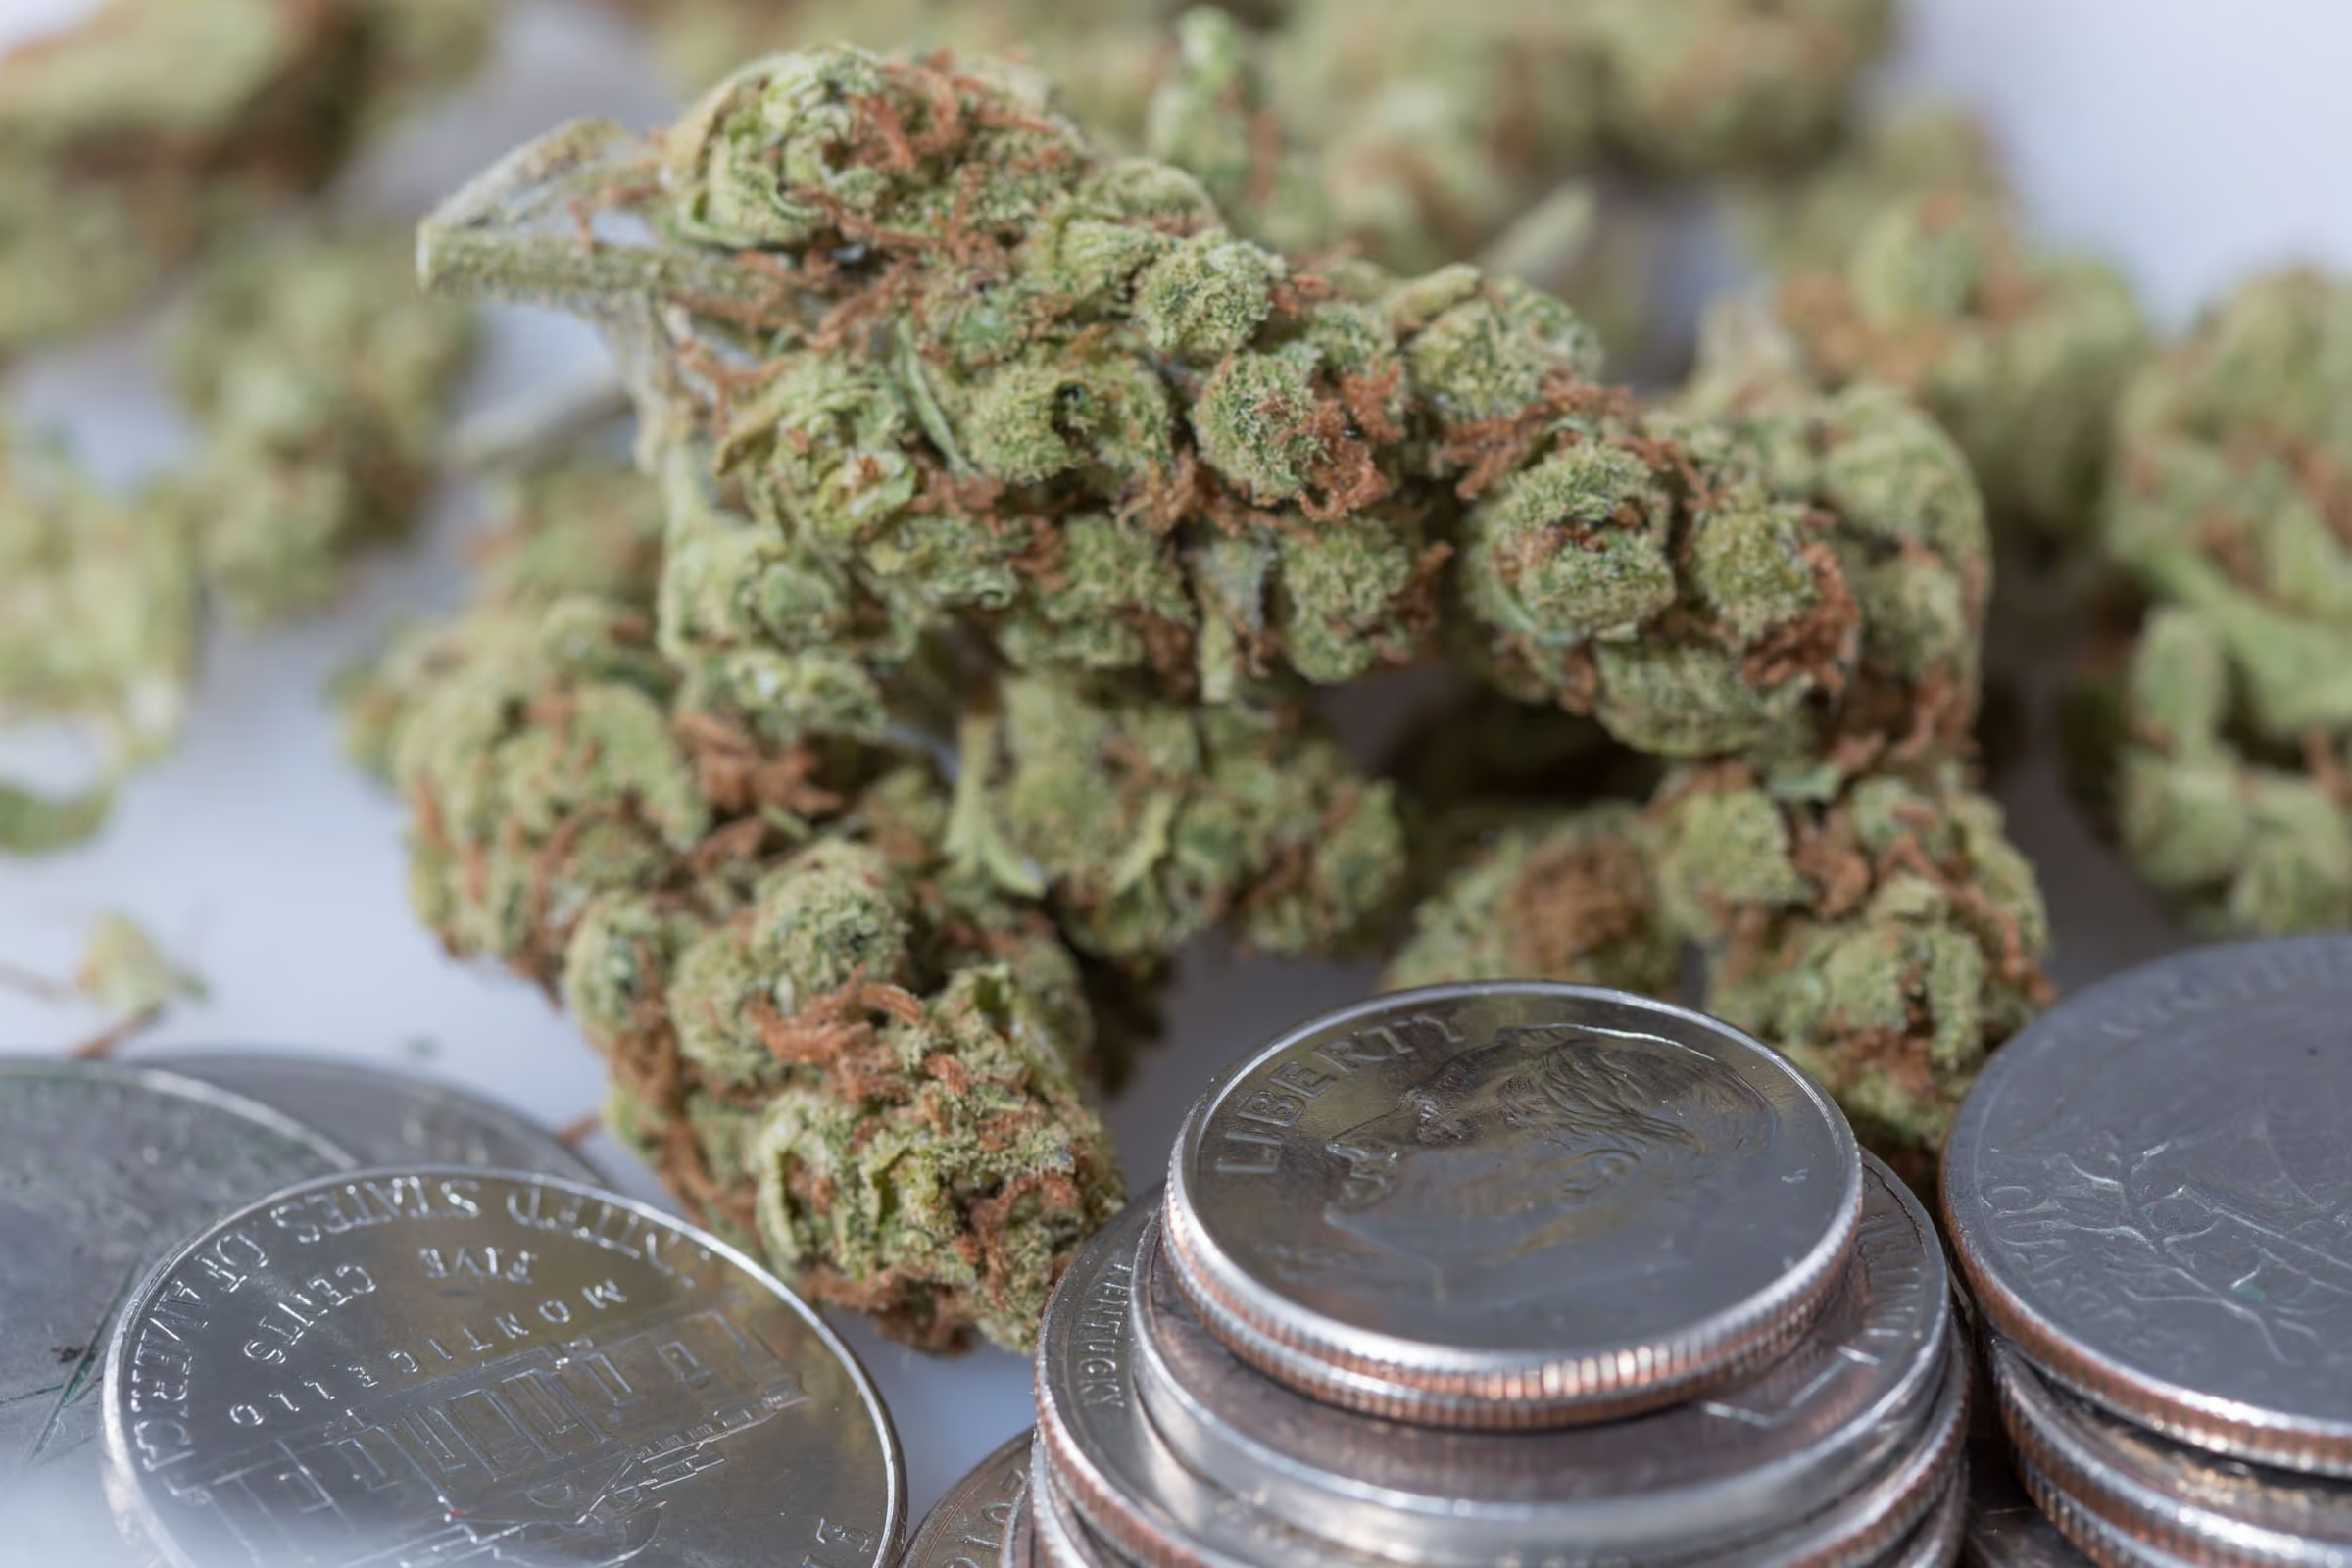
Ending the prohibition of marijuana and other currently illegal drugs and instead taxing and regulating their sales would supplement federal and state government budgets to the tune of up to $106.7 billion a year, according to a new analysis from a Harvard University researcher.
“At both the federal and state levels, government budgets would benefit enormously from drug legalization policies,” Jeffrey Miron, director of undergraduate studies in the Department of Economics at Harvard University, wrote in the report published on Monday by the libertarian Cato Institute.
“This report estimates that $47.9 billion is spent annually on drug prohibition enforcement, whereas $58.8 billion could potentially be raised in tax revenue.”
Miron, who also serves as director of economic studies at Cato, published a previous estimate of the economic impact of legalizing cannabis and other drugs in 2010, but actual revenues from states that have since legalized marijuana blew those projections out of the water.
“Washington collected nearly $70 million in marijuana tax revenues during the first year of legalization, almost exactly the estimate in the 2010 report once adjusted for inflation. In fiscal year 2016, however, Washington collected nearly triple that amount, and in fiscal year 2017 tax revenues reached nearly $320 million. Oregon collected only $20.6 million in fiscal year 2016, about half the 2010 estimate, but it collected $70.3 million in fiscal year 2017, well above the 2010 estimate. In Colorado, marijuana tax revenues have risen from $67.6 million in calendar year 2014 to $247.4 million in calendar year 2017. Even adjusting for inflation, those figures far outstrip the 2010 estimates as well as the updated estimates presented in this paper.”
In the new analysis, Miron speculates that the real numbers could be higher because of robust cannabis tourism in legalization state so far, or it could be because marijuana prices haven’t fallen as far as he initially projected would occur under legalization.
“Revenues may continue to increase over time as more stores open or if demand increases as a result of greater cultural acceptance of marijuana,” he wrote. “But revenues in existing legalization states may also moderate if other states or the federal government legalize marijuana. Another consideration is that a nontrivial share of tax revenue in Colorado, Oregon, and Washington has been generated from collection of one-time application and licensing fees… As recreational marijuana becomes a more established industry, states will likely see a decline in the number of new entrants and therefore a decline in licensing revenue.”
Aside from revenues, Miron also looks at potential criminal justice cost savings resulting from the end of drug prohibition, which he estimates are “likely to be modest in practice, even if the number of drug arrests falls substantially.”
“Early experience suggests that governments will reallocate rather than reduce those expenditures.”
See below for Miron’s state-by-state calculations on the impact of drug legalization, courtesy of Cato:
Table 1: State and local expenditures attributable to drug prohibition, billions of dollars, 2016
| All drugs | Heroin/cocaine | Marijuana | Synthetic | Other |
| 29.37 | 12.78 | 6.04 | 4.93 | 5.62 |
Table 2: State and local expenditures attributable to drug prohibition, millions of dollars, 2016
| State | All drugs | Marijuana | Heroin/cocaine | Other |
| United States | 29,374.9 | 6,036.9 | 12,779.2 | 10,555.4 |
| Alabama | 252.9 | 51.2 | 111.5 | 90.2 |
| Alaska | 111.8 | 17.4 | 54.0 | 40.4 |
| Arizona | 615.1 | 96.7 | 286.3 | 232.0 |
| Arkansas | 192.9 | 40.3 | 82.8 | 69.9 |
| California | 5,963.4 | 951.4 | 2,718.4 | 2,293.0 |
| Colorado | 422.3 | 64.2 | 200.1 | 157.9 |
| Connecticut | 314.9 | 74.1 | 142.3 | 98.5 |
| Delaware | 113.5 | 25.1 | 48.5 | 39.9 |
| Florida | 1,170.0 | 180.4 | 564.3 | 425.2 |
| Georgia | 1,339.2 | 424.0 | 457.9 | 457.8 |
| Hawaii | 172.6 | 33.9 | 72.8 | 65.8 |
| Idaho | 140.7 | 23.2 | 63.8 | 53.7 |
| Illinois | 713.1 | 125.4 | 334.9 | 252.7 |
| Indiana | 637.6 | 236.5 | 193.0 | 207.4 |
| Iowa | 204.8 | 59.0 | 77.1 | 68.5 |
| Kansas | 206.5 | 54.2 | 81.5 | 70.7 |
| Kentucky | 276.9 | 56.8 | 122.2 | 97.9 |
| Louisiana | 376.2 | 72.2 | 170.0 | 133.9 |
| Maine | 174.5 | 63.5 | 67.1 | 44.0 |
| Maryland | 514.9 | 77.5 | 248.7 | 188.6 |
| Massachusetts | 481.0 | 115.5 | 215.5 | 150.0 |
| Michigan | 860.3 | 200.9 | 356.2 | 302.7 |
| Minnesota | 443.5 | 130.7 | 164.1 | 148.4 |
| Mississippi | 278.7 | 86.3 | 96.9 | 95.6 |
| Missouri | 335.8 | 76.6 | 141.5 | 117.5 |
| Montana | 160.4 | 28.7 | 68.4 | 63.3 |
| Nebraska | 147.2 | 31.1 | 63.2 | 52.8 |
| Nevada | 223.3 | 34.6 | 106.6 | 82.1 |
| New Hampshire | 175.7 | 65.2 | 67.0 | 43.5 |
| New Jersey | 669.3 | 117.8 | 320.5 | 231.0 |
| New Mexico | 345.1 | 59.3 | 149.4 | 136.4 |
| New York | 1,889.6 | 308.8 | 915.1 | 665.4 |
| North Carolina | 891.2 | 263.3 | 319.0 | 309.3 |
| North Dakota | 310.7 | 153.7 | 62.6 | 94.0 |
| Ohio | 650.2 | 111.0 | 311.3 | 227.7 |
| Oklahoma | 589.5 | 209.5 | 182.1 | 198.2 |
| Oregon | 375.4 | 57.2 | 177.7 | 140.4 |
| Pennsylvania | 1,033.0 | 179.6 | 493.7 | 359.6 |
| Rhode Island | 203.6 | 76.1 | 77.4 | 50.2 |
| South Carolina | 244.7 | 47.4 | 108.9 | 88.4 |
| South Dakota | 158.8 | 67.5 | 40.9 | 50.2 |
| Tennessee | 342.7 | 53.9 | 165.1 | 123.7 |
| Texas | 1,711.5 | 291.3 | 798.2 | 621.9 |
| Utah | 767.3 | 151.9 | 300.1 | 315.3 |
| Vermont | 69.3 | 19.5 | 29.5 | 20.4 |
| Virginia | 602.1 | 81.2 | 296.1 | 224.7 |
| Washington | 545.8 | 82.4 | 259.3 | 204.0 |
| West Virginia | 270.1 | 94.5 | 85.4 | 90.3 |
| Wisconsin | 414.8 | 62.7 | 199.1 | 152.9 |
| Wyoming | 223.5 | 42.9 | 89.3 | 91.3 |
| District of Columbia | 47.2 | 8.5 | 22.0 | 16.7 |
Table 3: Federal expenditures attributable to drug prohibition, billions of dollars, 2015 (in 2016 dollars)
| All drugs | Marijuana | Cocaine | Heroin | Other |
| 18.47 | 3.96 | 8.42 | 1.47 | 4.61 |
Table 4: State and federal tax revenues from drug legalization, billions of dollars, 2016
| Total | Marijuana | Cocaine | Heroin | Other | |
| Federal revenues | 39.21 | 8.04 | 17.28 | 10.18 | 3.71 |
| State revenues | 19.60 | 4.02 | 8.64 | 5.09 | 1.86 |
Table 5: State tax revenues from drug legalization, distributed by population, millions of dollars, 2016
| State | Total | Marijuana | Cocaine | Heroin | Other |
| All states | 19,603.33 | 4,020.00 | 8,640.00 | 5,090.00 | 1,856.67 |
| Alabama | 296.52 | 60.81 | 130.69 | 76.99 | 28.08 |
| Alaska | 45.07 | 9.24 | 19.86 | 11.70 | 4.27 |
| Arizona | 416.48 | 85.41 | 183.56 | 108.14 | 39.45 |
| Arkansas | 181.91 | 37.30 | 80.18 | 47.23 | 17.23 |
| California | 2,382.11 | 488.49 | 1,049.89 | 618.51 | 225.61 |
| Colorado | 332.86 | 68.26 | 146.71 | 86.43 | 31.53 |
| Connecticut | 218.99 | 44.91 | 96.52 | 56.86 | 20.74 |
| Delaware | 57.67 | 11.83 | 25.42 | 14.97 | 5.46 |
| Florida | 1,236.75 | 253.62 | 545.09 | 321.12 | 117.13 |
| Georgia | 623.07 | 127.77 | 274.61 | 161.78 | 59.01 |
| Hawaii | 87.06 | 17.85 | 38.37 | 22.61 | 8.25 |
| Idaho | 100.97 | 20.71 | 44.50 | 26.22 | 9.56 |
| Illinois | 784.33 | 160.84 | 345.69 | 203.65 | 74.29 |
| Indiana | 403.97 | 82.84 | 178.05 | 104.89 | 38.26 |
| Iowa | 190.72 | 39.11 | 84.06 | 49.52 | 18.06 |
| Kansas | 177.57 | 36.41 | 78.26 | 46.11 | 16.82 |
| Kentucky | 270.30 | 55.43 | 119.13 | 70.18 | 25.60 |
| Louisiana | 285.22 | 58.49 | 125.71 | 74.06 | 27.01 |
| Maine | 81.22 | 16.65 | 35.79 | 21.09 | 7.69 |
| Maryland | 366.23 | 75.10 | 161.41 | 95.09 | 34.69 |
| Massachusetts | 414.44 | 84.99 | 182.66 | 107.61 | 39.25 |
| Michigan | 605.87 | 124.24 | 267.03 | 157.31 | 57.38 |
| Minnesota | 334.92 | 68.68 | 147.61 | 86.96 | 31.72 |
| Mississippi | 182.62 | 37.45 | 80.49 | 47.42 | 17.30 |
| Missouri | 371.19 | 76.12 | 163.60 | 96.38 | 35.16 |
| Montana | 63.05 | 12.93 | 27.79 | 16.37 | 5.97 |
| Nebraska | 115.69 | 23.72 | 50.99 | 30.04 | 10.96 |
| Nevada | 176.17 | 36.13 | 77.64 | 45.74 | 16.69 |
| New Hampshire | 81.26 | 16.66 | 35.81 | 21.10 | 7.70 |
| New Jersey | 545.86 | 111.94 | 240.58 | 141.73 | 51.70 |
| New Mexico | 127.09 | 26.06 | 56.01 | 33.00 | 12.04 |
| New York | 1,206.34 | 247.38 | 531.68 | 313.23 | 114.25 |
| North Carolina | 613.04 | 125.71 | 270.19 | 159.18 | 58.06 |
| North Dakota | 46.23 | 9.48 | 20.38 | 12.00 | 4.38 |
| Ohio | 708.95 | 145.38 | 312.46 | 184.08 | 67.15 |
| Oklahoma | 238.70 | 48.95 | 105.21 | 61.98 | 22.61 |
| Oregon | 245.86 | 50.42 | 108.36 | 63.84 | 23.29 |
| Pennsylvania | 781.45 | 160.25 | 344.42 | 202.90 | 74.01 |
| Rhode Island | 64.49 | 13.22 | 28.42 | 16.74 | 6.11 |
| South Carolina | 299.02 | 61.32 | 131.79 | 77.64 | 28.32 |
| South Dakota | 52.41 | 10.75 | 23.10 | 13.61 | 4.96 |
| Tennessee | 402.89 | 82.62 | 177.57 | 104.61 | 38.16 |
| Texas | 1,675.66 | 343.62 | 738.53 | 435.08 | 158.70 |
| Utah | 182.70 | 37.46 | 80.52 | 47.44 | 17.30 |
| Vermont | 38.25 | 7.84 | 16.86 | 9.93 | 3.62 |
| Virginia | 511.17 | 104.82 | 225.29 | 132.73 | 48.41 |
| Washington | 437.42 | 89.70 | 192.79 | 113.58 | 41.43 |
| West Virginia | 112.47 | 23.06 | 49.57 | 29.20 | 10.65 |
| Wisconsin | 352.36 | 72.26 | 155.30 | 91.49 | 33.37 |
| Wyoming | 35.83 | 7.35 | 15.79 | 9.30 | 3.39 |
| District of Columbia | 40.95 | 8.40 | 18.05 | 10.63 | 3.88 |
Table 6: Summary of expenditure savings and additional revenues from drug legalization, billions of dollars, 2016
| All drugs | Marijuana | Heroin/cocaine | Other | ||
| Expenditures | State | 29.4 | 6.0 | 12.8 | 10.6 |
| Federal | 18.5 | 4.0 | 9.9 | 4.6 | |
| Total | 47.9 | 10.0 | 22.7 | 15.2 | |
| Revenues | State | 19.6 | 4.0 | 13.7 | 1.9 |
| Federal | 39.2 | 8.0 | 27.5 | 3.7 | |
| Total | 58.8 | 12.0 | 41.2 | 5.6 |


